What Batting Average Doesn't Tell You About Your Hitters

Most youth coaches measure hitting by batting average. Over a full season, it does tell you something real. Your best hitters will generally have higher averages. That part works.
What batting average cannot tell you is whether your hitters are developing, or why they are struggling. A kid can bat .400 in 8U because the defense is disorganized and every ball through the infield is a hit. That same swing, unchanged, will bat .180 in high school when the defense catches up. The outcome number was masking the real picture.
The thing worth adding to your evaluation, the thing that more directly predicts results at every level of the game, is whether your hitters are squaring the ball up. Not how far it goes. Not how fast they swing. Whether the barrel is finding the ball.
Why Squaring the Ball Up May Matter More
Here is the number that reframes the conversation: a squared-up ball produces a .372 batting average at the major league level. A ball that is not squared up produces a .127 batting average. The same hitter, the same count, the same pitch speed. The only variable is whether the barrel found the ball.
That 245-point gap is not explained by who is throwing, what the count is, or how hard the batter swings. It comes down to contact quality. Whether the ball came off the center of the bat, the way the swing was designed to work.
Batting average captures the outcome. Squared-up rate gets closer to the cause. A hitter can go 0-for-4 with three loud outs and be developing exactly the right things. A hitter can go 2-for-4 on a blooper and a swinging bunt and have a mechanics problem that is about to become very visible against better pitching. The batting average looks the same. The contact quality tells a different story.
When you add this to your evaluation, it shifts what you are trying to accomplish in batting practice. The goal is not just "get a hit." It is to square the ball up consistently. Batting average tends to follow.
How to Develop This at Practice (Ages 6-18)
Youth coaches do not have MLB's tracking system. There are no radar guns at a 10U practice, and there should not be. But a coach does not need any technology to develop a feel for squared-up contact. It happens faster than most coaches expect.
The sound is the first thing. A squared-up ball makes a clean, sharp crack. Not a dull thud, not a metallic clank, not a thin ping off the end. The sound of barrel on ball is distinct and recognizable. After a few hundred reps of focused observation, coaches can identify squared-up contact almost immediately. Train yourself to listen, not just watch.
The trajectory is the second thing. Squared-up balls produce line drives and hard grounders. They go where the batter is swinging, not off at odd angles. A pop-up is almost always a contact miss. A weak grounder to the pull side is almost always a contact miss. A line drive to the opposite field is almost always a squared-up ball. Watch the ball off the bat, not the whole flight path.
Hands and follow-through are the third thing. A batter who squares the ball up rarely feels vibration in the hands. The physics work out when the barrel meets the ball cleanly, and the swing continues with momentum. A contact miss produces a sting, a jerky follow-through, or a ball that dies immediately off the bat. Ask your hitters after each swing: did that feel clean?
Drills that build squared-up rate:
- Tee work from multiple positions (inside, outside, high, low) teaches the hitter to find the barrel regardless of location. Move the tee around every five swings. The goal is not to swing hard. It is to make the same clean sound from every position.
- Front toss with an emphasis on hitting line drives, not fly balls. If the ball is going up, the barrel is under the ball at contact. Reset and try again.
- Short-distance flips with a heavy ball give immediate feedback because a mis-hit is obvious by feel. You cannot muscle a heavy ball. You have to find the barrel.
- Side toss to the opposite-field gap. This forces proper path and timing. Hitters who pull everything are almost always hitting around the ball, not through it.
Build a dedicated contact quality block into your practice plans. Not warm-up filler. An intentional 15-minute block where squared-up contact is the only thing being evaluated.

A common blind spot for youth coaches is measuring only the final outcome. They watch how far the ball travels and assume that means the swing was good. A ball that carries to the fence off a mis-hit with a metal bat at youth levels can mask a mechanics problem for years. The question to add alongside "did it go?" is "where did it come off the bat, and did it sound right?"
Why It Is True: The Data
To understand why squaring the ball up matters so much, you need to understand what the metric actually measures.
MLB's tracking system can tell when a hitter finds the sweet spot of the bat. Not just hard contact, contact where the barrel is in exactly the right position at exactly the right moment. That is what squared-up means.
That distinction matters for coaches at every level. A player with a 65 mph bat speed who consistently hits the ball at full efficiency is squaring it up just as well as a player with a 75 mph bat speed doing the same thing. This measures contact quality independent of how hard the hitter swings, which makes it more useful for evaluating hitters at every size and strength level.
The outcome data is not subtle.
| Contact Type | Batting Average | Slugging |
|---|---|---|
| Squared-Up | .372 | .659 |
| Not Squared-Up | .127 | .144 |
| Difference | +.245 | +.515 |
A batting average of .372 is MVP-caliber production. A batting average of .127 is below the Mendoza line by a wide margin. The slugging split is even more dramatic: .659 versus .144. The only variable is contact quality.
A weakly hit ball is as likely to produce an out as a strikeout would be. The defensive alignment does not matter much because weak contact rarely finds gaps or clears outfielders. This is the same principle that underlies OBP vs batting average: the quality of contact affects not just average but overall offensive value.
Who Squares Up the Ball Best?
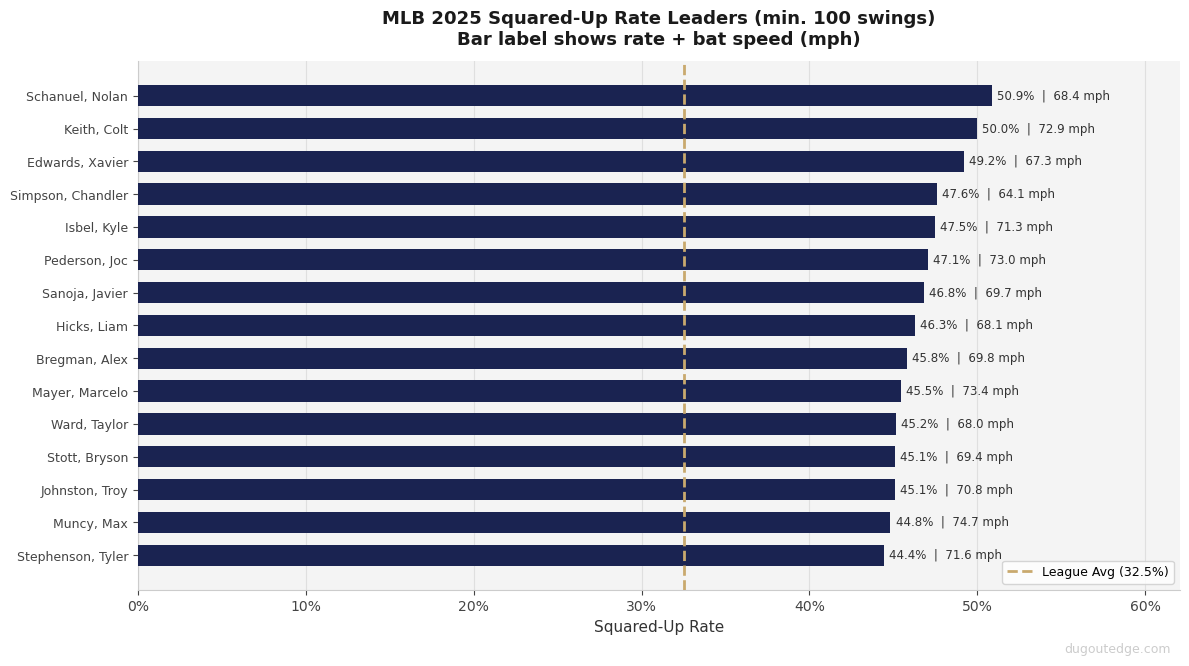
I pulled the 2025 MLB bat tracking leaderboard from Baseball Savant and analyzed major league hitters with a full season's worth of at-bats. Here are the top 15 in squared-up rate, defined as squared-up contact per ball put in play (excluding whiffs from the denominator, which gives a cleaner read on contact quality).
| Player | Squared-Up Rate | Bat Speed (mph) |
|---|---|---|
| Nolan Schanuel | 50.9% | 68.4 |
| Colt Keith | 50.0% | 72.9 |
| Xavier Edwards | 49.2% | 67.3 |
| Chandler Simpson | 47.6% | 64.1 |
| Kyle Isbel | 47.5% | 71.3 |
| Joc Pederson | 47.1% | 73.0 |
| Javier Sanoja | 46.8% | 69.7 |
| Liam Hicks | 46.3% | 68.1 |
| Alex Bregman | 45.8% | 69.8 |
| Marcelo Mayer | 45.5% | 73.4 |
| Taylor Ward | 45.2% | 68.0 |
| Bryson Stott | 45.1% | 69.4 |
| Troy Johnston | 45.1% | 70.8 |
| Max Muncy | 44.8% | 74.7 |
| Tyler Stephenson | 44.4% | 71.6 |
Look at the bat speed column. There is no pattern. Chandler Simpson sits at 64.1 mph, one of the lowest bat speeds in the majors, and he is fourth on this list. Nolan Schanuel leads at 50.9 percent with a 68.4 mph bat speed, below the league average of 71.8 mph. Xavier Edwards is at 67.3 mph and ranks third overall.
Players with 74 and 75 mph bat speeds are scattered throughout the middle of the list, not at the top of it.
This leaderboard is not a list of the hardest swingers in the game. It is a list of the most efficient barrel-deliverers in the game. Those are different skills. The coach who builds practices around bat speed development is chasing the wrong variable. The coach who builds practices around barrel contact is developing the skill that actually determines outcomes. You can see the same pattern in the short swing data: Chandler Simpson and Xavier Edwards both appear near the top of the shortest swings list. Contact efficiency and swing compactness are connected.
Squared-Up Rate and Bat Speed: They Are Not the Same Thing
The chart below plots squared-up rate against average bat speed for all the MLB hitters in the 2025 dataset.
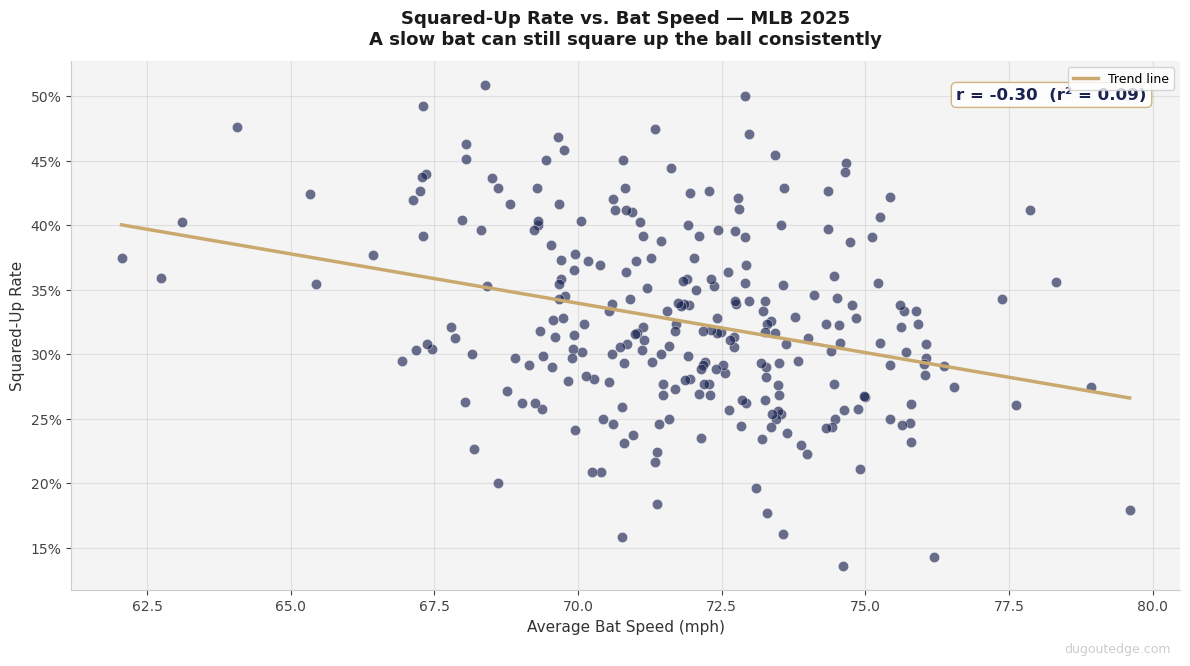
Here is something surprising: hitters with faster swings are actually slightly less likely to square the ball up. The connection is small but consistent across the 2025 season. Swinging harder does not automatically mean better contact.
What this means practically: bat speed alone accounts for a small fraction of what determines squared-up rate. The rest comes down to timing, eye-hand coordination, approach, swing path, and plate discipline. Things that can be coached. Things that can be developed through repetition. Things that do not require waiting for a kid to grow into a stronger body.
When coaches tell hitters to swing harder, they are optimizing for the small piece. When coaches work on timing, path, and feel for the barrel, they are working on the big piece. Spend practice time accordingly.
A player can maximize their bat speed on every swing and still be below average at squaring the ball up. A player with a below-average bat can lead a major league roster in squared-up rate if their mechanics and timing are right. The kids on your team who are smaller or younger than their teammates are not at a disadvantage here. They can be developed into hitters right now.
The league average squared-up rate in 2025 is 32.5 percent. The range runs from 13.6 percent to 50.9 percent. That is a massive spread for a population of professionals who are all, by definition, elite. Mechanics and coaching matter across all levels of ability.
Hitters who swing on the same plane as the incoming pitch tend to square the ball up more often. That is a separate skill from bat speed, and it is coachable. It is also the foundation that makes barrel efficiency possible, which is exactly what the attack angle data shows.
Caveats and Nuance
Squared-up rate is available as a season aggregate in public Baseball Savant data, not as a per-pitch or per-swing breakdown. The analysis here is based on MLB hitters with at least 50 competitive swings in 2025, measured through early April of the season.
The published outcome statistics (.372 BA and .659 SLG on squared-up balls, .127 BA and .144 SLG on non-squared-up balls) come from MLB and Baseball Savant reporting. These are major league results against major league pitching. Youth level contact quality will produce different absolute numbers given slower pitch speeds and different defensive alignments. The relative relationship holds: squared-up contact produces dramatically better outcomes at every level of the game.
The negative relationship between squared-up rate and bat speed is based on the 2025 season sample. The direction and general character of that relationship is consistent with prior seasons.
In This Series
These articles use public MLB data to answer questions youth coaches actually ask:
- Do MLB Hitters Change Their Swing With 2 Strikes?
- Bat Speed Doesn't Matter As Much As You Think
- The 5-20 Degree Window: Attack Angle Explained
- What a Short Swing Actually Means
- Blasts: The Most Valuable Swing in Baseball
- How to Set Your Batting Order: What MLB Data Says
- When to Bunt: What Run Expectancy Data Says
- When to Steal: The Break-Even Math
Data sourced from Baseball Savant Bat Tracking Leaderboard. Outcome statistics (.372 BA, .659 SLG on squared-up balls) sourced from MLB/Baseball Savant published reports. Analysis run April 11, 2026. 2025 MLB regular season.
About the Author
Former Stanford baseball player and professional in the Seattle Mariners organization. 7 years in professional data analytics. Founder of Dugout Edge.
Tags
Measure Your Exit Velocity
Use our free exit velocity calculator to turn bat speed and pitch speed into expected exit velo, with benchmarks by age and level.
Open the Calculator