When to Steal: The Break-Even Math Behind the Running Game
Your fastest runner is on first. The pitcher is slow to the plate. The catcher is average at best. You look at your runner, you look at the count, and you think: do I send him?
Most coaches make that call on instinct. Speed, pitcher tempo, catcher arm, game situation. All of that matters. But there is one variable that gets underweighted in almost every youth dugout, and it is the most important one: how often does this runner actually succeed when you send him?
Because there is a number. A threshold. Below it, the stolen base attempt hurts your team more than it helps, regardless of how fast your runner is or how slow the catcher throws. Above it, the green light is correct. It is not about the individual play. It is about the expected value over the course of a season.
Knowing that threshold is the difference between smart baserunning and handing out free outs.
The Math Behind a Stolen Base Attempt
Every stolen base attempt has exactly two outcomes: success or failure. A successful steal advances the runner and changes the game state in your favor. A caught stealing removes the base runner from the bases and adds an out. Both outcomes have a measurable value in expected runs.
Sabermetricians have quantified this with a tool called the run expectancy matrix. The framework, developed by Tom Tango and grounded in Retrosheet play-by-play data, maps every possible game state (all 24 combinations of base runners and outs) to the average number of runs scored from that state through the end of the inning in MLB games. These are not projections. They are observed averages computed from decades of MLB play-by-play data. For a full explanation of the run expectancy framework and how it applies to bunting decisions, see When to Bunt: What Run Expectancy Data Says.
The logic is clean. If you know the expected runs in the current state, the expected runs after a successful steal, and the expected runs after a caught stealing, you can calculate exactly what success rate you need to make the attempt worth it.
The formula: break-even rate = (cost of failure) / (value of success + cost of failure).
That is the only math you need. Everything else is plugging in numbers.
Verdict: You Need 72% or Better to Break Even Stealing Second
The most common stolen base situation is a runner on first with nobody out. Here is the math.
The run expectancy matrix from 2024-25 MLB data gives us three numbers:
- RE(1B, 0 outs) = 0.859 runs. What you expect to score with a runner on first and nobody out.
- RE(2B, 0 outs) = 1.100 runs. What you expect after a successful steal of second.
- RE(empty, 1 out) = 0.254 runs. What you expect after a caught stealing (runner gone, one out added).
Value of a successful steal: 1.100 - 0.859 = +0.241 expected runs gained.
Cost of a caught stealing: 0.254 - 0.859 = -0.605 expected runs lost.
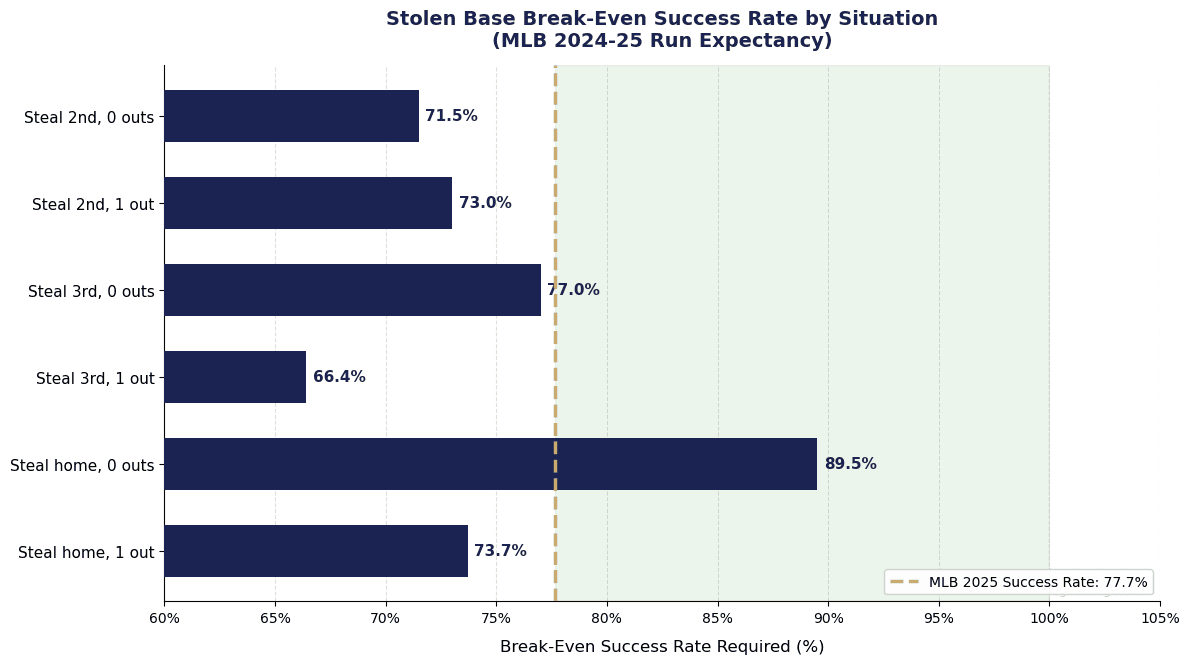
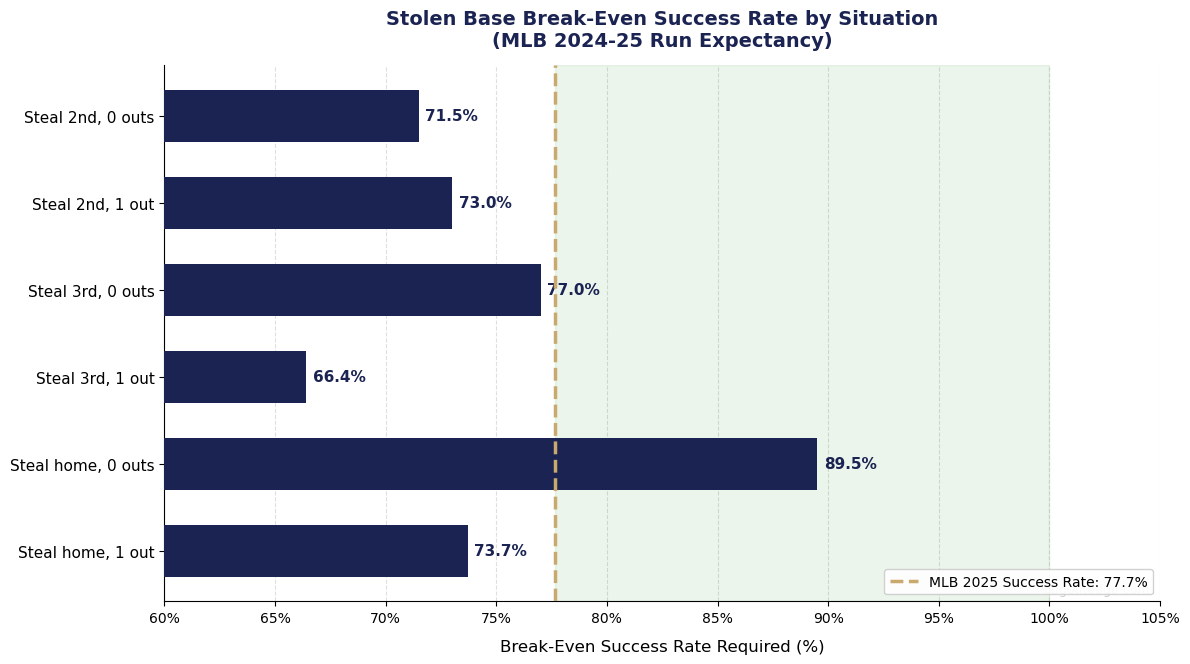
Break-even: 0.605 / (0.241 + 0.605) = 71.5%.
That is the number. If your runner succeeds at stealing second 71.5% of the time or better from that situation, the expected value of the attempt is positive. Below 71.5%, every attempt chips away at your expected run total.
With one out, the math shifts slightly. The value of being caught is smaller (you are already partway through your outs), but so is the value of the stolen base. The break-even climbs to 73.0%.
| Situation | Break-Even Success Rate |
|---|---|
| Steal 2nd, 0 outs | 71.5% |
| Steal 2nd, 1 out | 73.0% |
| Steal 3rd, 0 outs | 77.0% |
| Steal 3rd, 1 out | 66.4% |
| Steal home, 0 outs | 89.5% |
| Steal home, 1 out | 73.7% |
A quick note on steal home: the break-even at 89.5% with nobody out reflects how valuable a runner on third with nobody out already is. You are giving up one of the best states in baseball for a coin flip. Only attempt it when you are genuinely confident the pitcher has no awareness of you and the play is completely automatic.
What MLB Teams Actually Do: How the Rules Changed Everything
For most of baseball history, MLB teams stole bases at rates that barely cleared the break-even line. The league success rate hovered in the low-to-mid 70s for years. Positive, but only marginally.
Then 2023 happened.
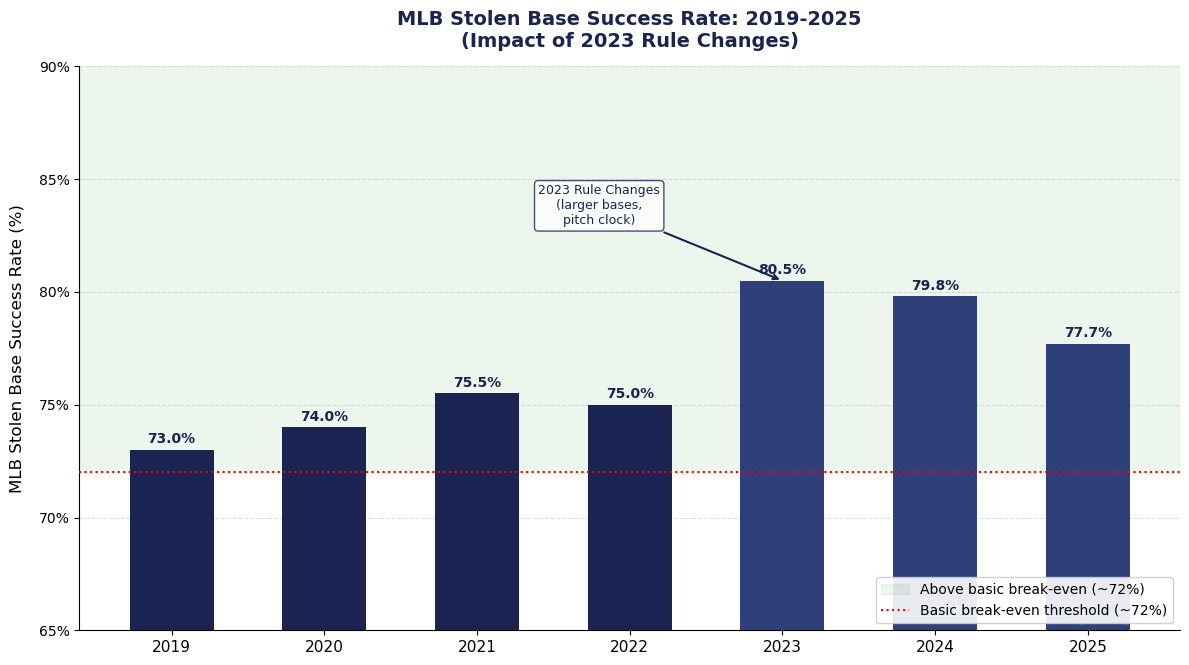
Two rule changes completely altered the economics of stealing bases. First, the bases grew from 15 inches to 18 inches square. That sounds minor. It is not. The increased base size reduced the effective distance from first to second by approximately 4.5 inches. At top speed, that is a meaningful fraction of a second. Second, the pitch clock came with a hard cap on pickoff and step-off attempts, pitchers can only disengage from the rubber twice per plate appearance without the runner advancing. Once that limit is hit, a third disengagement is a balk.
The combined effect: runners got a head start, and pitchers lost their most reliable deterrent. The league stolen base success rate jumped from 75.0% in 2022 to 80.5% in 2023, the highest rate in decades.
In 2025, I pulled the actual numbers from the MLB Stats API: 3,440 stolen bases, 989 caught stealings, on 4,429 total attempts. The league-wide success rate is 77.7%. That is comfortably above the 71.5% break-even for the most common steal situation. MLB teams, as a whole, are making positive-value stolen base decisions.
This matters for context. When you hear analytics people argue that stolen bases are undervalued or overvalued, they are referencing a specific era's data. The 2023 rule changes reset the baseline. Under the current rules, a 77-80% success rate league-wide means the stolen base is a net-positive play for most MLB baserunners in most situations.
Stealing Third Is Almost Never Worth It With Nobody Out
The numbers above show something that surprises coaches the first time they see it: stealing third with nobody out has the highest break-even in the most intuitive steal situations at 77.0%.
Here is why. With a runner on second and nobody out, you are already in an excellent position. The run expectancy is 1.100 runs. If you steal third successfully, you gain 0.252 expected runs (moving to 1.352). But if you get caught, you go from runner on second with nobody out (1.100 expected runs) to bases empty with one out (0.254 expected runs). That is a swing of 0.846 runs. The cost-to-benefit ratio is brutal.
You need to be succeeding 77% of the time to break even. MLB catchers throw out runners attempting to steal third at roughly a 25-30% rate depending on the situation. That means only the very fastest MLB runners (those succeeding at 80-85% or better) are making a positive-value play stealing third with nobody out.
The conventional wisdom that "third base is not worth stealing" has the math on its side when the bases are empty and you have no outs. You are already in position to score. Do not waste the out.
With one out, the math actually relaxes to a 66.4% break-even, because the cost of getting caught (going from one out to two outs) is smaller relative to the value gained. This is counterintuitive but correct. If you have a runner on second with one out and your fastest player is running, the expected value is closer to neutral than most coaches realize.
The practical rule: with nobody out and a runner on second, hold the runner unless he is one of your fastest players facing one of the worst-throwing catchers in your league.
Youth Baseball Has Different Math
Everything above assumes MLB-level defenders. MLB catchers average a pop time (release to second base) of around 2.0 seconds. MLB pitchers have sophisticated pickoff moves and pitch sequence awareness that keeps runners honest. That is not your league.
Youth baseball changes the practical success rate dramatically, even though the break-even threshold stays the same.
At youth levels, especially 8 to 12 year olds, three things happen that shift the real-world numbers:
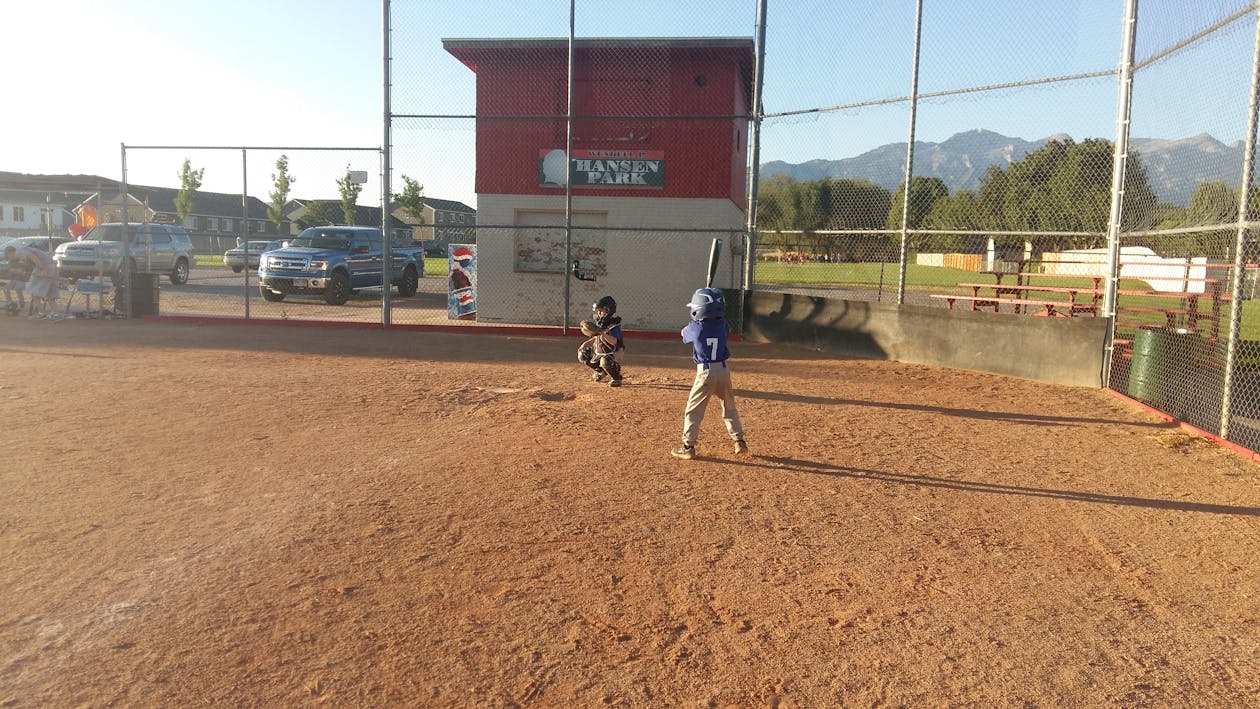
Catchers are slower. Pop times at youth levels can range from 2.5 seconds at the competitive travel level up to 3.5-plus seconds at rec ball. That extra time matters enormously. A runner who would be out by a step in an MLB context is safe by several steps at the youth level. Real-world success rates for a fast youth runner against a weak catcher can reach 85-90% or higher.
Pitchers are less aware. Youth pitchers are focused on throwing strikes. They are not consistently checking runners, varying their timing, or throwing over to hold runners close. This gives base stealers a larger, more consistent lead and a more predictable moment to go.
Wild pitches and passed balls happen. In youth baseball, the ball gets away often enough to make aggressive baserunning even more valuable. A runner who is thinking about going may get an opportunity without even stealing in the traditional sense.
The mathematical break-even threshold does not change: you still need 71.5% to justify stealing second with nobody out. What changes is the realistic success rate for your runner in that specific matchup. In youth ball, that rate is often well above the threshold, which is why aggressive baserunning is a legitimate competitive advantage at younger ages.
The important implication: if your runner is succeeding at less than 72% against the catchers and pitchers in your league, stop sending him. The break-even is the break-even, regardless of age level.
A Simple Framework for Youth Coaches
The math gives you a threshold. Coaching gives you the data to compare against it. Here is a practical process for thinking through stolen base decisions:
Track your runner's success rate over the season. This does not have to be formal. Keep a mental tally or a note in your scorebook. If a player has been thrown out three times in five attempts, that is 60%, below break-even. Stop sending him until something changes about the opponent or his technique.
Adjust for the specific matchup. Break-even rates assume average defenders. When you face a catcher with a clearly weak arm, your runner's real-world success rate is higher than his season average. When you face a pitcher who throws to first and stays slow, the same adjustment applies. The framework is not rigid. It is a tool for thinking clearly.
Respect the outs. The cost of a caught stealing in a one-run game in the final innings is higher than the run expectancy matrix implies, because runs become discrete rather than continuous as the game narrows. With a one-run lead in the last inning, giving away an out is especially costly. The break-even threshold for that situation should be treated as higher than 71.5%.
Situational awareness matters. Runner on second with nobody out and your three-four-five hitters coming up? The expected value of a steal attempt is lower because the expected value of standing pat is already high. The stolen base does not add as much value when you have good hitters and a good situation. Let them hit. For context on how lineup construction affects which hitters follow your baserunners, see How to Set Your Batting Order: What MLB Data Says.
The pitcher counts too. A high strike rate, fewer balls in the dirt, and a pitcher who holds runners effectively all reduce the practical value of stealing. A pitcher who bounces pitches, works slowly, or ignores runners creates opportunities. Your read of the pitcher in real time is data the matrix does not have.
A Note on This Data
Run expectancy assumes average MLB outcomes across all base-out states. The break-even rates computed here are based on the 2024-25 MLB run expectancy matrix, which represents the most current publicly available data from that framework. The exact values shift slightly from year to year as run-scoring environments change, but not enough to alter the practical thresholds in any meaningful way.
The 2025 MLB stolen base totals (3,440 SB, 989 CS, 77.7% success rate) were retrieved from the MLB Stats API on April 11, 2026. The season was ongoing at time of retrieval; final-season totals will differ slightly.
One important caveat for youth coaches: the break-even framework assumes an average hitter follows the base runner. If your cleanup hitter is at the plate, the value of the stolen base attempt is somewhat discounted. You have a good hitter who might drive the runner in anyway, making the stolen base less necessary. If a weak hitter is up, the stolen base becomes more valuable because you need to manufacture the run. This situational adjustment is real and worth considering, even if it is difficult to quantify at the youth level.
The Number Is Not Complicated
Roughly 70 to 75 percent, depending on the situation. That is the range every youth coach needs to carry in their head.
If your runner clears that threshold against this pitcher and this catcher in this game situation, send him. The expected value is on your side. If he does not clear it, the out costs you more than the base is worth. Over a season, those decisions compound in both directions.
I played baseball at Stanford and professionally in the Mariners organization. I have spent seven years in data analytics. The stolen base question seems instinctual until you put numbers to it. Then it becomes a decision you can make confidently, with a clear rationale, rather than a guess you defend after the fact.
Track your runners. Know their success rates. Give yourself a framework. The math is on your side if you use it.
In This Series
These articles use public MLB data to answer questions youth coaches actually ask:
- Do MLB Hitters Change Their Swing With 2 Strikes?
- Bat Speed Doesn't Matter As Much As You Think
- The 5-20 Degree Window: Attack Angle Explained
- What a Short Swing Actually Means
- Batting Average Is Lying to You About Your Hitters: What to Measure Instead
- Blasts: The Most Valuable Swing in Baseball
- How to Set Your Batting Order: What MLB Data Says
- When to Bunt: What Run Expectancy Data Says
Break-even calculations based on the MLB run expectancy matrix (2024-25 season averages, Tom Tango RE24 framework). Stolen base success rate history from Baseball Reference and Baseball Savant. 2025 season totals from MLB Stats API. Analysis run April 11, 2026.
About the Author
Former Stanford baseball player and professional in the Seattle Mariners organization. 7 years in professional data analytics. Founder of Dugout Edge.
Tags
Ready to Generate Your Perfect Lineup?
Try our free softball and baseball lineup generator to create balanced, fair lineups in minutes.
Try Free Lineup Generator