Struggling to Set Your Batting Order? Here Is What MLB Statistics Say.

You have the lineup card in front of you. You know who your best hitter is. You know who your weakest hitter is. But the eight spots in between feel like a puzzle with too many right answers. You second-guess yourself, you ask another coach, and you still are not sure.
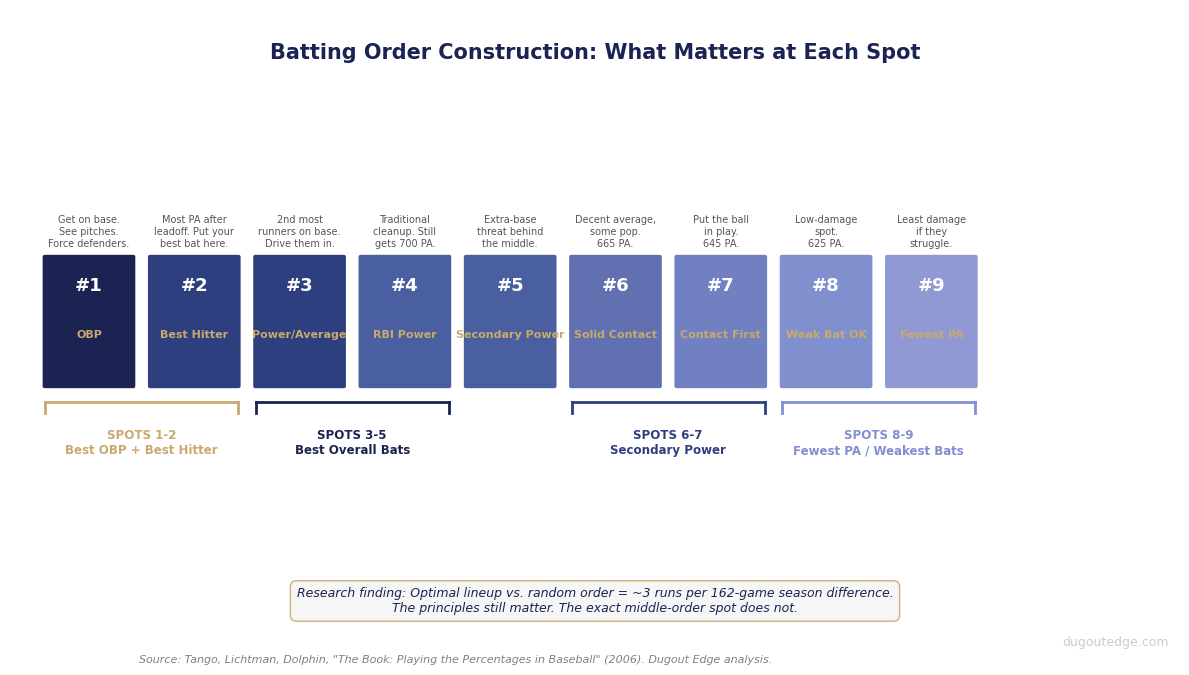
That feeling is universal. Every coach at every level has been there. The good news is that decades of baseball analytics have a clear answer. Put your highest on-base percentage player at the top. Bat your best overall hitter second. Put your weakest bats at the bottom. That is the framework. The rest is fine-tuning.
Here is the data behind it.
The Framework
The No. 1 spot goes to your best OBP player. Not your fastest kid. The player most likely to be on base when your best hitter comes up.
The No. 2 spot goes to your best overall hitter, full stop. That is where he gets the most plate appearances while still having a runner in front of him the majority of the time.
The No. 3 spot sees more runners on base than any other spot in the lineup because it follows two hitters who should be getting on base regularly. Put your best remaining power or RBI bat there.
Spots 4 and 5 round out the core of the order. Put real hitters there. Spots 6 and 7 are for players with some pop but less consistency. Spots 8 and 9 are for your weakest bats. Fewest plate appearances, fewest situations with runners on base. That is where you minimize damage.
Two decisions move the needle more than anything else: do not put your worst hitters at the top of the order, and give your best hitters the most plate appearances. Everything else is fine-tuning.
Why It Works: The Plate Appearances Data
The most important insight in lineup construction has nothing to do with RBIs, batting average, or which player is "clutch." It is arithmetic.
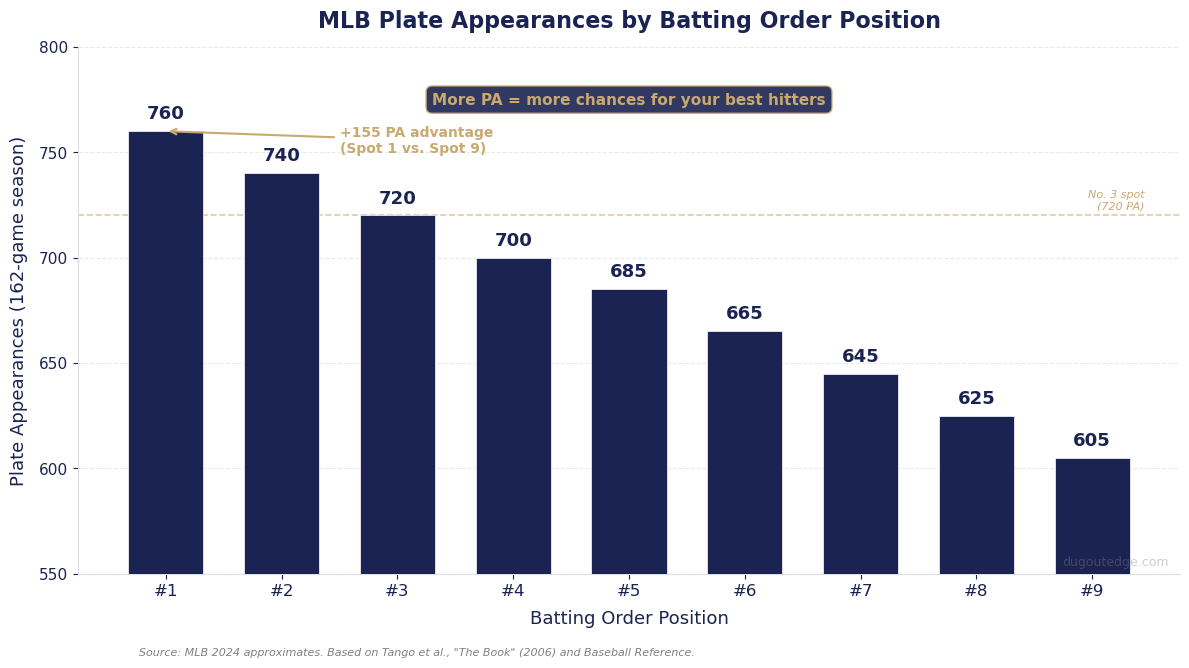
Your No. 1 hitter gets more plate appearances than your No. 2 hitter. Your No. 2 hitter gets more than your No. 3. This pattern continues all the way down to your No. 9 hitter, who gets the fewest plate appearances of anyone in the lineup. Over a full season, the gap is not trivial.
| Lineup Spot | Approx. PA (162 games) |
|---|---|
| 1 | 760 |
| 2 | 740 |
| 3 | 720 |
| 4 | 700 |
| 5 | 685 |
| 6 | 665 |
| 7 | 645 |
| 8 | 625 |
| 9 | 605 |
Your No. 1 hitter gets approximately 155 more plate appearances than your No. 9 hitter across a 162-game season. That is essentially a full extra month of at-bats. Every one of those extra opportunities is a chance to help your team score. Every one of those extra opportunities wasted on a hitter who cannot get on base is a run left on the field.
This is the foundational logic. You want your best hitters at the top of the order, where they will get the most chances to help you win. Not because of any mystical property of the leadoff spot or the cleanup spot. Because math says more plate appearances for better hitters equals more runs.
For youth coaches, the scale is different but the principle holds. A 15-game season compresses the arithmetic, but your best hitters still get materially more plate appearances at the top than at the bottom. Over a full season of 12 to 15 games, Spot 1 might see 3 to 5 more at-bats than Spot 9. At youth levels where half the lineup might bat in a given inning, that compounds quickly.
The Tango Research: How Much Does Lineup Order Actually Matter?
Here is the most counterintuitive finding in all of baseball strategy: a completely random batting order costs your team roughly 3 runs per season compared to a perfectly optimized one.
Three runs. The entire season. That is the difference between sending nine players to the plate in whatever order they happen to appear on a sheet of paper versus finding the best possible batting order through research. Tom Tango, Mitchel Lichtman, and Andrew Dolphin published this finding in "The Book: Playing the Percentages in Baseball" in 2006, and it has held up across subsequent research.
The instinct when you hear that number is to conclude that batting order barely matters. That conclusion misses the point.
The 3-run gap is the average MLB manager against a theoretical optimum. It is not the gap between a coach who understands lineup construction and one who puts the seven worst hitters at the top. The principles behind good lineup construction are real and teachable. They tell you exactly what to prioritize, what to stop worrying about, and how to stop making the one mistake that actually does cost runs.
Your Leadoff Spot Is Not About Speed
Ask any youth coach what they look for in a leadoff hitter and the first answer is almost always speed. Fast kid, goes first. The thinking is linear: fast runner plus anyone who can put the ball in play equals stolen bases and runs scored.
That is getting the priority backwards.
The most important trait for a leadoff hitter is on-base percentage, how often they reach base. Not speed. Not contact rate. Not the ability to bunt. Getting on base. (For a deeper look at why on-base percentage outperforms batting average as a predictive stat, see OBP vs. Batting Average: Which Stat Actually Matters More.)
Think about it this way: an empty base helps no one. A runner on first means your next three hitters all have a chance to drive someone in. That is not just a feel thing, analysts have tracked millions of plate appearances and the data confirms it. A runner on base roughly doubles the chance of scoring in that inning compared to nobody on. The No. 2 hitter, the No. 3 hitter, every hitter behind the leadoff spot benefits from the leadoff man being on base.
A fast leadoff hitter who makes outs does nothing for your offense. He is still standing in the dugout when the next guy comes up. A slow leadoff hitter who gets on base 39 percent of the time is not glamorous, but he is creating opportunities for your lineup every single time he steps in the box.
Speed matters as a multiplier once a player is on base. A fast runner who gets on base is extremely valuable. A fast runner who makes outs is just a fast out.
For youth coaches, the translation is direct: your leadoff hitter should be the player most likely to reach base. That might also be your fastest player. But if your fastest player has a weak batting eye and whiffs a lot, he is not your best leadoff option. Look for the kid who takes pitches, puts the ball in play, and does not swing at balls in the dirt.
Your Best Hitter Should Not Bat Cleanup
This is where lineup construction departs most sharply from baseball tradition.
For generations, the cleanup hitter has been the team's best power hitter. Bat fourth, protect the guys in front of you, drive in the runs they set up. Coaches at every level have organized their lineups around the cleanup spot. It is as embedded in baseball culture as the seventh-inning stretch.
The research says that is the wrong spot for your best bat.
The No. 2 spot gets 40 more plate appearances per season than the No. 4 spot. Over 162 games, your cleanup hitter is getting to the plate less often than your No. 2 hitter. If you put your best overall hitter at cleanup because that is where the best hitter goes, you are giving him fewer plate appearances than he would get if you batted him second. That gap compounds over a full season.
Modern MLB teams have started reflecting this in their lineups. Several franchises now bat their best hitter second rather than third or fourth. The two-hole is not a traditional "leadoff hitter who can also hit" position anymore. It is increasingly where smart organizations put their highest-value bat.
Tango's research in "The Book" confirms that the ideal order for getting the most out of your lineup puts the best overall hitter in the second slot, not third or fourth. The runner-creation ability of the leadoff spot and the plate appearance advantage of the No. 2 spot make the top of the order the highest-value positions in the lineup, not the middle.
The traditional cleanup hitter concept emerged from an era when the thinking was: load the bases with three decent hitters, then bring up the slugger to clear them. But optimizing for "slug with the bases loaded" is not the same as optimizing for run production over a full season. The best hitter should get the most opportunities, which means he should not be sitting behind three plate appearances before he bats in the first inning.
For youth coaches, the takeaway is simple. Do not automatically slot your best player at cleanup because the cleanup spot sounds important. The No. 2 or No. 3 spot is where your best hitter gets more opportunities and faces pitchers who cannot yet fully adjust their approach to him. For a more detailed breakdown of how to apply these principles to a youth roster, see the Batting Order Strategy guide for youth coaches.

Youth Baseball Complication: Equal Playing Time
Many youth leagues operate under rules that affect batting order directly. Some require every player on the roster to bat in order, removing lineup construction from the equation entirely. Others require equal plate appearances across a season, which limits how strategically you can position hitters across games.
Even within those constraints, understanding lineup principles helps. When you do have discretion in a given game, knowing where to place which players makes your choices deliberate rather than arbitrary. When your league uses a continuous batting order with the full roster, the data tells you that the players at spots 1 through 4 will get more plate appearances than those at 7 through 10. Put your stronger hitters there when you have a choice.
For coaches who rotate the batting order each game to ensure fairness, this is a thoughtful and reasonable approach. You are trading lineup optimization for player development and team culture, which is often the right call at youth levels. The framework still applies within any given game, but the seasonal optimization looks different when the priority is giving every player meaningful opportunities at every lineup position over the course of the year. When you are ready to build and save a lineup for your team, the Dugout Edge Lineup Generator lets you set your order, track your roster, and generate lineups in seconds.
The One Thing That Does Not Matter Much: The Exact Order of the Middle
The 3-runs-per-season finding is instructive here. Most of that small gap between a great lineup and a random one comes from two mistakes: batting weak hitters in high-value spots, and batting strong hitters in low-value spots.
Once you have avoided those mistakes, the exact order of the middle spots barely matters.
Whether your third hitter bats third or fourth, or your fifth hitter bats fifth or sixth, moves the needle very little. The difference between lineup arrangements in the middle of the order comes down to fractions of a run per season. A coach who spends significant time deciding whether the No. 4 or No. 5 hitter should swap spots is not getting much return on that investment.
You do not need a perfect lineup. You need a good one. Keep your best hitters near the top, your worst hitters at the bottom, and stop agonizing over the specific slots within those groups.
At youth levels, player confidence and at-bat context matter alongside the pure arithmetic. A young player who is struggling might benefit from a lower-pressure spot in the lineup even if the data suggests he is a middle-of-the-order talent. Good coaching uses the data framework as a guide, not a rigid mandate.
A Note on This Data
Tango's 3-run research is based on MLB-level hitters playing in MLB run environments. Professional baseball players have skills, consistency, and pitch recognition that compress the performance gap between the best and worst hitters in the lineup. At youth levels, the variance is much larger.
When your No. 9 hitter strikes out 40 percent of the time and your No. 1 hitter gets on base 45 percent of the time, the value difference between those two slots is larger than in MLB. The 3-run finding is a floor for how much lineup construction matters. At youth levels, it almost certainly matters more, not less, because the skill gap between your best and worst hitters is wider.
Youth baseball also has higher error rates and more wild pitches, which means base runners create scoring opportunities even without contact. This further increases the value of putting your best on-base percentage hitter at the top of the order. Every baserunner creates more scoring chances per inning when the defense is less reliable and pitches bounce more often.
The specific numbers do not translate directly from the research. The direction of the findings does.
In This Series
These articles use public MLB data to answer questions youth coaches actually ask:
- Do MLB Hitters Change Their Swing With 2 Strikes?
- Bat Speed Doesn't Matter As Much As You Think
- The 5-20 Degree Window: Attack Angle Explained
- What a Short Swing Actually Means
- Batting Average Is Lying to You About Your Hitters: What to Measure Instead
- Blasts: The Most Valuable Swing in Baseball
- When to Bunt: What Run Expectancy Data Says
- When to Steal: The Break-Even Math
Plate appearance estimates based on MLB 2024 season data. Research citation: "The Book: Playing the Percentages in Baseball" by Tom Tango, Mitchel Lichtman, and Andrew Dolphin (2006). Analysis run April 11, 2026.
About the Author
Former Stanford baseball player and professional in the Seattle Mariners organization. 7 years in professional data analytics. Founder of Dugout Edge.
Tags
Ready to Generate Your Perfect Lineup?
Try our free softball and baseball lineup generator to create balanced, fair lineups in minutes.
Try Free Lineup Generator