Stop Chasing Bat Speed. Here Is What Actually Predicts Hitting Success.

You have probably watched a kid on your team swing as hard as he can and miss everything. You have also probably seen a smaller kid make consistent hard contact. The data explains why.
Every coach's first instinct when a hitter looks passive at the plate is the same: "Swing harder. You need more bat speed." It is not a bad instinct. Speed feels like power. Power feels like production. But the relationship between bat speed and offensive output is weaker than almost anyone realizes, and coaching toward it at the expense of everything else causes real damage to young hitters.
The Answer
Barrel accuracy matters more than raw bat speed for most hitters, especially at the developmental level. Build barrel accuracy first.
That is the recommendation. The rest of this article explains how to apply it at practice and shows you the MLB data behind it.
What This Means at Practice
If the goal is to build hitters who produce, the most valuable thing you can do at every practice is give players more reps putting the sweet spot on the ball, not reps trying to swing harder.
Here is what that looks like for different age groups.
Ages 6-9: Tee Work With a Target
The tee is your best friend at this age because the ball is not moving. There is no excuse for missing the sweet spot.
Put a tee up at belt height on the inside half of the plate. Have the player take 10 swings and watch where the ball is coming off the bat. Are they hitting off the end? Off the handle? You can hear it and you can see the trajectory. Weak contact goes nowhere. Barrel contact jumps.
The cue that works at this age: "Hit it with the fat part." Not "swing harder." Not "explode." Just "hit it with the fat part." Kids understand that.
Give them a target. Put a cone 30 feet away in the direction you want them to drive the ball. The goal is not to hit it hard. The goal is to hit the cone. Barrel accuracy first.
Ages 10-13: Soft Toss to Build Timing
Once players can consistently hit the tee with the sweet spot, move to soft toss. This introduces timing while keeping the ball in a predictable location.
Feed the ball from the side, around knee to waist height, location consistent. The hitter's job is to drive it to the opposite field gap. Why opposite field? Because it forces them to stay through the ball. Players who are cheating for power pull off early and miss barrels. Opposite field toss work punishes that habit and rewards the right one.
Track contact quality, not exit velocity. Did they hit it on the barrel? That is the question after every rep.
Cue: "Stay through it. Don't help it. Just hit it."
Ages 14-18: Live BP With a Contact Zone
At this age, players are starting to develop real bat speed naturally. The coaching priority is making sure that speed is applied accurately, not generated at the expense of barrel control.
In BP, call out zones. "Inside pitch. You should be pulling this one." "Away pitch. Take it the other way." Make them think about matching their swing path to the pitch location before the pitch arrives. Plate discipline starts as a mental habit before it becomes a physical one.
The best drill at this age is a two-strike drill: put every hitter in the cage into a two-strike count mentally. No strikeouts allowed. See the ball, put the barrel on it, make something happen. That mindset produces the same barrel-first approach the data tells us drives production.
Cue: "Two strikes. Short path to the ball. Hit it where it's pitched."
Why It Works: The MLB Data
Here is how we know barrel accuracy matters more than raw bat speed. The numbers come from major league hitters with a full season's worth of at-bats in 2025, using bat tracking data from Baseball Savant's Bat Tracking Leaderboard. MLB's tracking system captures bat speed on every swing, so the dataset is about as clean as it gets.
Some Definitions First
Bat speed is measured at the sweet spot of the bat on competitive swings, in miles per hour. The league average in 2025 was 71.67 mph. The fastest hitters average close to 80 mph. The slowest average in the low 60s.
Overall offensive production (officially called wOBA, or weighted on-base average) is the most complete single measure of how much a hitter's at-bats helped his team score. It weights each outcome, single, double, walk, home run, by how many runs that outcome is actually worth. A .350 mark is around average. .400 is excellent. .420 and above is elite. Think of it as a cleaner version of on-base plus slugging that actually reflects run value instead of just adding two stats together.
Squared-up rate is the percentage of swings where the hitter makes contact near the sweet spot of the bat. This is the stat most directly tied to barrel accuracy.
| Metric | League Average (2025) | |--------|----------------------| | Avg Bat Speed | 71.67 mph | | Avg Swing Length | 7.33 ft | | Avg Squared-Up Rate | 24.6% | | Avg Fast-Swing Rate | 23.8% | | Avg Blast Rate | 10.1% |
The Correlation That Should Settle the Debate
Avg Bat Speed vs. Overall Offensive Production: Weak positive relationship across 332 major league hitters with a full season's worth of at-bats
Squared-Up Rate vs. Overall Offensive Production: Essentially no relationship in isolation across the same sample
The connection between bat speed and offensive production is real but surprisingly weak. Across all major league hitters in 2025, bat speed explained only about 2 percent of the difference in how much damage hitters did at the plate. That is not nothing, but it is much less than most coaches assume.
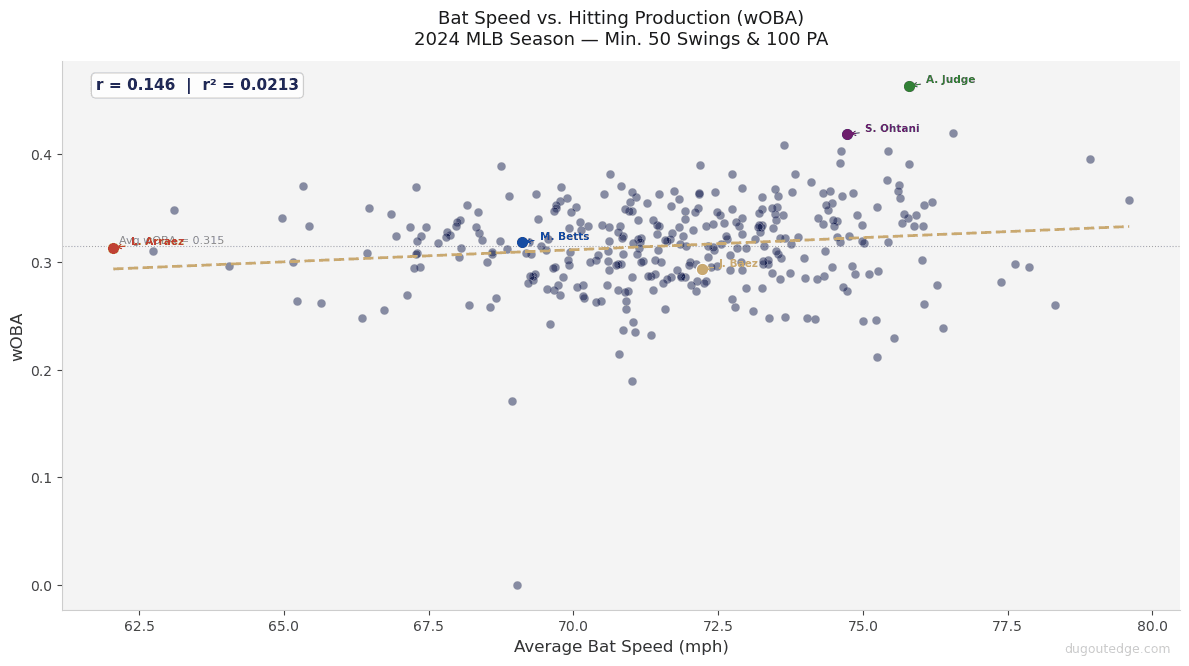
Look at that scatter plot. It is a cloud. Players with 75 mph bat speed post offensive production marks of .240 and .440 in the same dataset. The fastest bat in baseball is not predicting the highest production.
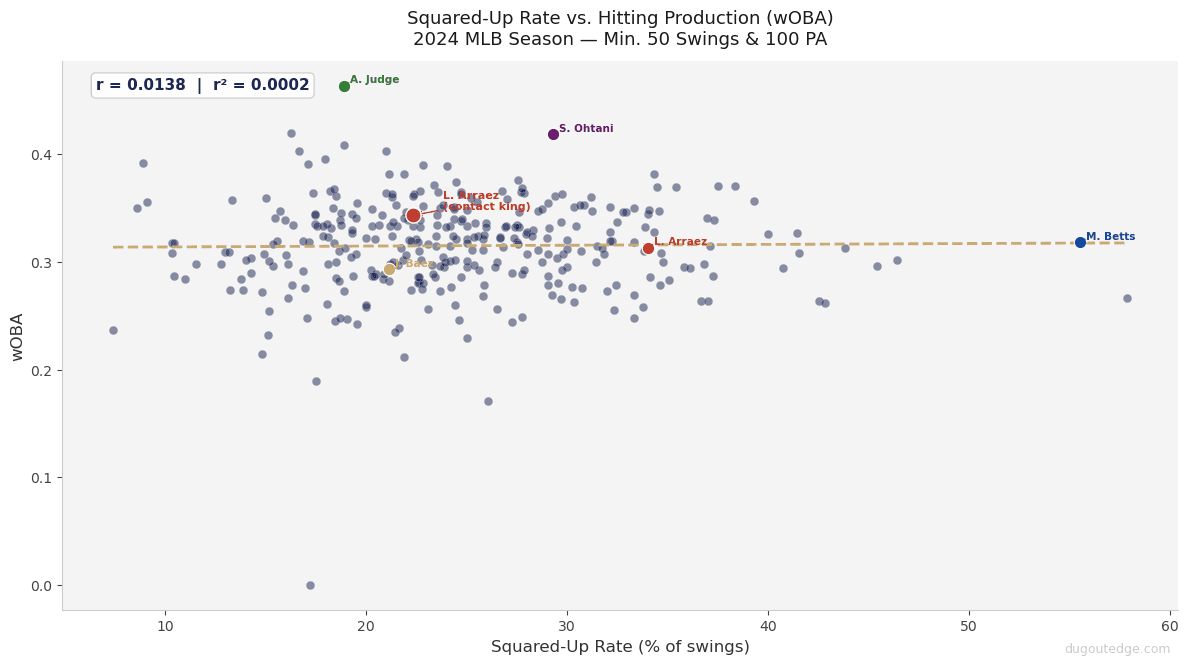
Squared-up rate in isolation is also flat. High barrel accuracy alone does not guarantee production. Neither does bat speed alone.
The correct lesson from both charts: production requires multiple things working together. Bat speed, barrel accuracy, pitch selection, plate discipline. When any one is missing, the others cannot fully compensate. No single swing metric carries the whole thing.
The Best Case Study in Baseball: Luis Arraez
Luis Arraez is the most clarifying player in this dataset.
In 2025, his average bat speed was 62.1 mph. The MLB average was 71.67 mph. Arraez is not just slow by MLB standards. He is near the very bottom of all major league hitters with a full season's worth of at-bats, sitting in roughly the bottom 5% of bat speed.
He hit .292 with strong offensive production numbers across 675 plate appearances.
| Player | Bat Speed | Bat Speed Percentile | Squared-Up Rate | BA | wOBA | |--------|-----------|---------------------|----------------|-----|------| | Luis Arraez | 62.1 mph | Bottom 5% | 34.0% | .292 | .313 | | Javier Baez | 72.2 mph | Above avg | 21.1% | .257 | .293 |
How does a player with a historically slow bat remain one of the most productive contact hitters in baseball? His squared-up rate is 34.0%. The MLB average is 24.6%. Arraez squares the ball up nearly 10 percentage points more often than the average hitter. He almost never swings at pitches outside the zone. He does not need to overpower the baseball because he almost never makes bad contact.
Arraez is the proof point for what the data is telling us. The fastest bat in the world does not help you if you are hitting it off the end of the bat. What Arraez does is take his manageable bat speed and apply it with extraordinary precision to pitches he can actually handle. His career is built entirely on doing the other things at an elite level.
For a youth coach, this is the most instructive player profile in the game.
The Cautionary Tale: Speed Without Precision
Compare Arraez to Javier Baez in 2025.
Baez came in at 72.2 mph bat speed, above the league average. He has the physical advantage Arraez lacks. He also has a squared-up rate of 21.1%, which is below the league average of 24.6%. He hit .257 with a .293 overall offensive production mark across 437 plate appearances.
Baez produces less than a player whose bat speed is in the bottom 5% of the league. The reason is well documented: he expands the strike zone aggressively, swings at pitches he cannot drive, and his contact rate on balls outside the zone consistently sends the physical gift of above-average bat speed into weak contact situations. His squared-up rate reflects the result.
This is not a case study about Baez being a bad player. It is a case study about what happens when speed is not paired with discipline and precision. The physical tool alone does not carry you.
The Top-10 Mismatch: Fastest Bats vs. Best Hitters
One more way to see this clearly: the top-10 bat speed list and the top-10 overall offensive production list barely overlap.
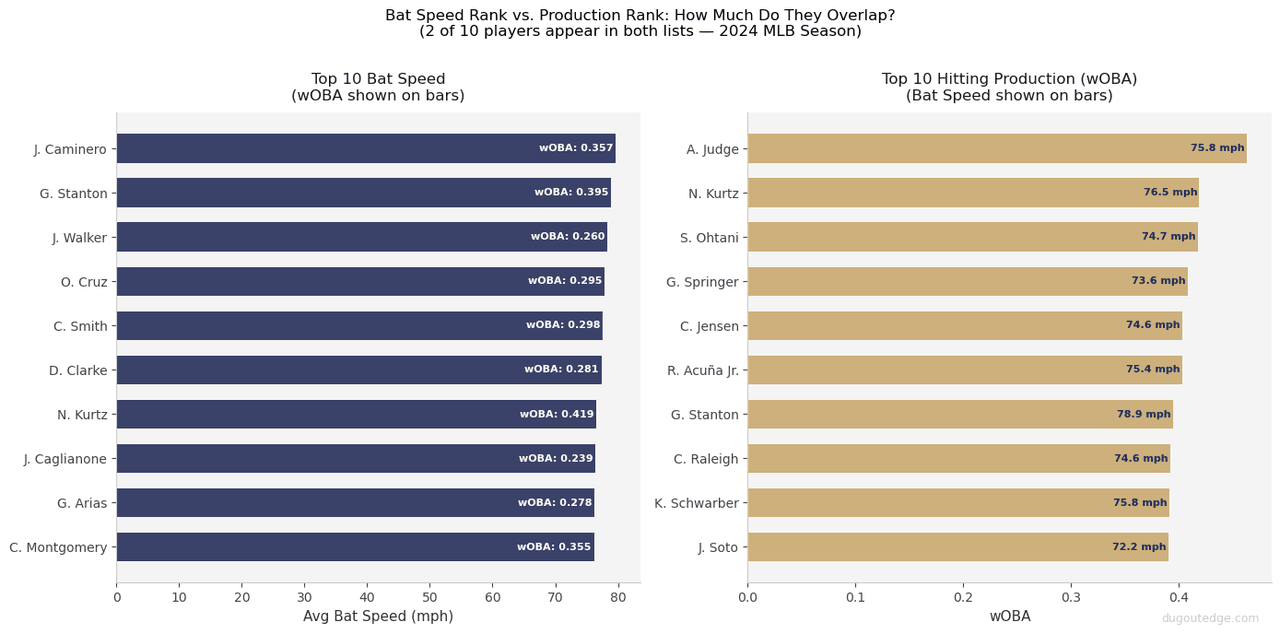
Top 10 by Average Bat Speed (2025):
| Rank | Player | Bat Speed | wOBA | Squared-Up Rate | |------|--------|-----------|------|-----------------| | 1 | Junior Caminero | 79.6 mph | .357 | 13.3% | | 2 | Giancarlo Stanton | 78.9 mph | .395 | 17.9% | | 3 | Jordan Walker | 78.3 mph | .260 | 24.4% | | 4 | Oneil Cruz | 77.9 mph | .295 | 23.9% | | 5 | Cam Smith | 77.6 mph | .298 | 18.1% | | 6 | Denzel Clarke | 77.4 mph | .281 | 22.6% | | 7 | Nick Kurtz | 76.5 mph | .419 | 16.3% | | 8 | Jac Caglianone | 76.4 mph | .239 | 21.6% | | 9 | Gabriel Arias | 76.3 mph | .278 | 16.3% | | 10 | Colson Montgomery | 76.2 mph | .355 | 9.1% |
Top 10 by wOBA (2025):
| Rank | Player | wOBA | Bat Speed | Squared-Up Rate | |------|--------|------|-----------|-----------------| | 1 | Aaron Judge | .463 | 75.8 mph | 18.9% | | 2 | Nick Kurtz | .419 | 76.5 mph | 16.3% | | 3 | Shohei Ohtani | .418 | 74.7 mph | 29.3% | | 4 | George Springer | .408 | 73.6 mph | 18.9% | | 5 | Ronald Acuna Jr. | .403 | 75.4 mph | 21.0% | | 6 | Carter Jensen | .403 | 74.6 mph | 16.7% | | 7 | Giancarlo Stanton | .395 | 78.9 mph | 17.9% | | 8 | Cal Raleigh | .392 | 74.6 mph | 8.9% | | 9 | Kyle Schwarber | .391 | 75.8 mph | 17.1% | | 10 | Juan Soto | .390 | 72.2 mph | 22.8% |
Only 2 players appear on both lists: Nick Kurtz and Giancarlo Stanton. The player with the highest overall offensive production in baseball, Aaron Judge at .463, does not make the top-10 bat speed list. Jordan Walker has the third-fastest average bat speed in the dataset and posted a .260 mark. Jac Caglianone sits at 76.4 mph bat speed with a .239 mark.
Notice also that several of the best hitters in baseball, Ohtani, Soto, Springer, have bat speeds in the average-to-above-average range, not at the extreme. What they share is the ability to make the right decision on which pitches to attack and then attack those pitches with precision. If bat speed were the primary driver of hitting production, these lists would look nearly identical. They do not.
A Few Things Worth Knowing Before You Use This
The caveat worth knowing: this is MLB data and youth baseball plays differently. But the direction of the finding holds. The kid who learns to make consistent contact early will outperform the kid who just swings hard.
Beyond that, the data suggests bat speed is not irrelevant. It matters. At the extremes, the fastest bats in baseball have real advantages, particularly against high velocity pitching. The point is that bat speed is not the single most important variable. It is one variable among several, and in isolation it explains almost nothing about who produces at the plate.
The lesson is not "bat speed doesn't matter." The lesson is "bat speed alone is not the answer."
At the developmental level, there is one more complication worth flagging: a youth player who chases bat speed too early often tightens up through the hands and forearms, gets a longer loopier swing path, and loses barrel control in the process. They start expanding the strike zone because they feel like they need to do more with every pitch. Contact quality goes down. Walk rate goes down. Strikeouts go up. The hitter who was already struggling now has worse mechanics and a worse approach. The chase for mph creates the problem you were trying to solve.
The Verdict
Bat speed explains about 2 percent of the difference in offensive production across major league hitters in 2025. Luis Arraez, with a bat speed in the bottom 5% of all of baseball, hit .292 across 675 plate appearances.
One approach that works well: build barrel accuracy first. Tee work, soft toss to the opposite field, two-strike drills in the cage. Give players language they can act on: "fat part of the bat," "stay through it," "hit it where it's pitched." Speed will develop naturally as players get stronger. Precision has to be taught.
When you are building your batting order around contact quality rather than raw power, the Dugout Edge lineup generator can help you slot players based on their actual tendencies instead of just gut feel.
The next article in this series looks at attack angle, the vertical path of the bat through the hitting zone and how it interacts with launch angle outcomes. The data there is more nuanced than the conventional wisdom suggests, and the coaching implications are practical. Read it here: The 5-20 Degree Window: Attack Angle Explained.
In This Series
These articles use public MLB data to answer questions youth coaches actually ask:
- ABS Challenges 2026: Who Wins More, Hitters or Catchers?
- Do MLB Hitters Change Their Swing With 2 Strikes?
- The 5-20 Degree Window: Attack Angle Explained
- What a Short Swing Actually Means
- Batting Average Is Lying to You About Your Hitters: What to Measure Instead
- Blasts: The Most Valuable Swing in Baseball
- How to Set Your Batting Order: What MLB Data Says
- When to Bunt: What Run Expectancy Data Says
- When to Steal: The Break-Even Math
Data sourced from Baseball Savant Bat Tracking Leaderboard and Expected Statistics Leaderboard. Analysis run April 11, 2026. 2025 MLB regular season, 332 qualified players (minimum 25 competitive swings).
About the Author
Former Stanford baseball player and professional in the Seattle Mariners organization. 7 years in professional data analytics. Founder of Dugout Edge.
Tags
Measure Your Exit Velocity
Use our free exit velocity calculator to turn bat speed and pitch speed into expected exit velo, with benchmarks by age and level.
Open the Calculator