Who is Better at ABS Challenges: Hitters or Catchers? I Pulled the Data and Found 3 Other Things
If you follow Major League Baseball, the story of the 2026 season is ABS. The Automated Ball-Strike Challenge System. For the first time in MLB history, teams can challenge ball-and-strike calls in real time. Each team gets two challenges per game. Get it right, you keep the challenge. Get it wrong twice, you're done.
It is the biggest rule change since the pitch clock, and the data behind it is completely new. Everything gets tracked on Baseball Savant. I went and got it.
I played baseball at Stanford and professionally in the Mariners organization. I have spent seven years in data analytics. When a brand-new dataset drops on something I care about, I open the laptop.
There is one question I kept seeing come up in the early coverage of ABS: who is better at challenges, hitters or catchers? I had the same question. And I want to be precise about what "better" even means here, because the two groups are challenging from completely different places with completely different goals.
Here is what the data shows.
First, the Distinction That Matters
Before we get to the numbers, we need to be clear about something that a lot of ABS coverage gets wrong.
Two separate challenge pools exist in every game:
A hitter challenge is issued from the batter's box. The hitter saw a pitch, the umpire called it a strike, and the hitter thinks it was a ball. They challenge it. Win rate reflects how often they were right.
A catcher challenge is issued from behind the plate. The opposing pitcher threw what looked like a strike, the umpire called it a ball, and the catcher thinks it was a strike. They challenge it. Win rate reflects how often they were right.
These are separate events, separate data columns in Baseball Savant, and they should not be combined into a single leaderboard without making this distinction.
There is also a confusing case worth naming directly: some of the players who appear on the hitter leaderboard are catchers by defensive position. Ivan Herrera of the Cardinals, for example, is a catcher. But when he steps into the batter's box and challenges a call, that is a hitter challenge, not a catcher challenge. His defensive position does not change which pool he belongs to in that moment. I note which players in the leaderboard are catchers by position so you can see this clearly.
1. Verdict: Catchers Win, by a Lot
| Role | Where They Challenge | Challenges | Wins | Win Rate |
|---|---|---|---|---|
| Hitters | From the batter's box | 382 | 182 | 47.6% |
| Catchers | From behind the plate | 264 | 160 | 60.6% |
| Total | 646 | 342 | 52.9% |
Catchers are winning challenges at a significantly higher rate than hitters. 60.6% versus 47.6% is not close. That is a 13-point gap.
This makes intuitive sense when you think about what each group is doing. Catchers spend every game planted directly behind the plate, watching every pitch travel from release to glove. They see pitch shape, they see where it crosses the zone, and they have years of experience building a mental model of where the strike zone actually is versus where umpires tend to call it. When they challenge from behind the plate, they are saying: I saw that pitch, it crossed the zone, and I know it.
Hitters are in a different situation. They are trying to hit a baseball moving at 90-plus miles per hour while simultaneously forming an opinion on whether it clipped a corner. They challenge strikes they did not swing at, which means they thought it was a ball while it was still in the air. Winning at 47.6% from that position is actually respectable.
The verdict is catchers, and it is not close.
2. Who is Winning the Most Hitter Challenges?
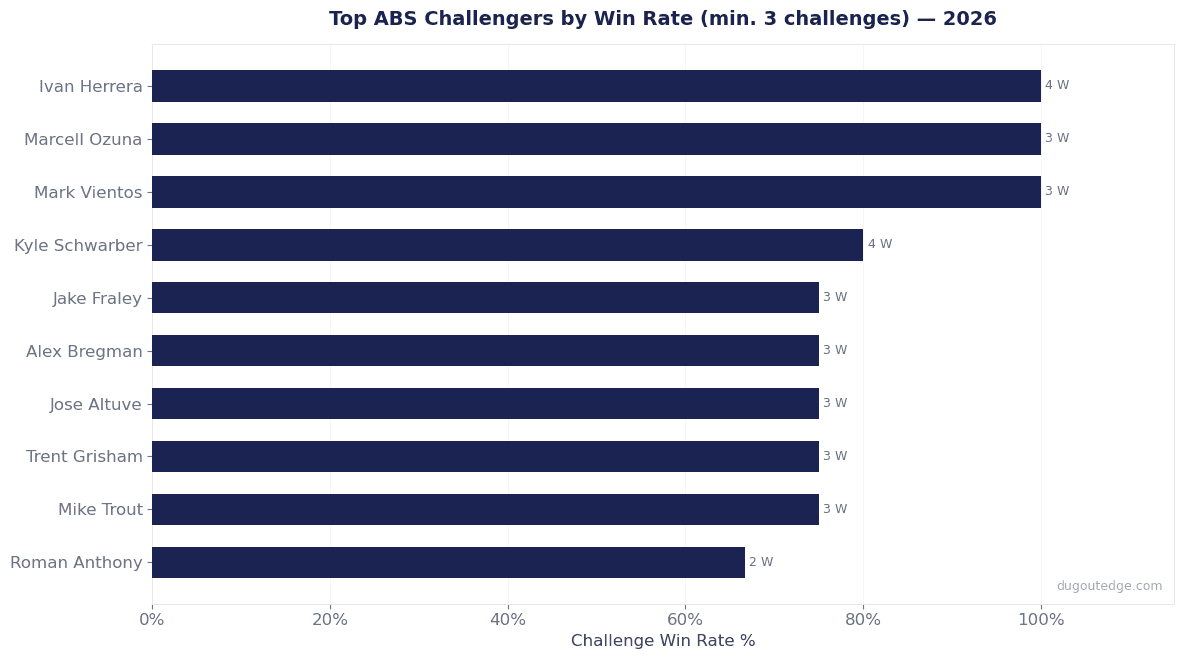
These are the players with the best challenge win rate from the batter's box, minimum four hitter challenges. The Pos column shows defensive position, so you can see exactly which players are catchers by trade stepping into the box.
Top Hitter Challengers by Win Rate (min. 4 hitter challenges)
| Rank | Player | Pos | Team | Hitter Challenges | Wins | Win Rate | O-Swing% | BB% |
|---|---|---|---|---|---|---|---|---|
| 1 | Ivan Herrera | C | STL | 5 | 4 | 80.0% | -- | -- |
| 2 | Jake Fraley | LF | TB | 4 | 3 | 75.0% | 17.6% | 12.5% |
| 3 | Alex Bregman | 3B | CHC | 4 | 3 | 75.0% | 11.1% | 11.1% |
| 4 | Jose Altuve | 2B | HOU | 4 | 3 | 75.0% | 23.9% | 21.1% |
| 5 | Mike Trout | CF | LAA | 4 | 3 | 75.0% | 18.6% | 20.0% |
| 6 | Trent Grisham | CF | NYY | 4 | 3 | 75.0% | 12.7% | 22.9% |
| 7 | Kevin McGonigle | 2B | DET | 4 | 3 | 75.0% | 28.0% | 10.9% |
| 8 | Kyle Schwarber | LF | PHI | 6 | 4 | 66.7% | 17.9% | 20.4% |
| 9 | Josh Bell | 1B | MIN | 6 | 3 | 50.0% | 22.8% | 15.7% |
| 10 | Ronald Acuna Jr. | RF | ATL | 5 | 2 | 40.0% | -- | -- |
| 11 | Jose Caballero | SS | NYY | 5 | 2 | 40.0% | -- | -- |
| 12 | Jazz Chisholm Jr. | 3B | NYY | 4 | 1 | 25.0% | 26.7% | 6.4% |
| 13 | Matt Wallner | LF | MIN | 4 | 1 | 25.0% | -- | -- |
| 14 | Steven Kwan | LF | CLE | 4 | 1 | 25.0% | -- | -- |
| 15 | Wyatt Langford | LF | TEX | 4 | 1 | 25.0% | -- | -- |
| 16 | Hunter Goodman | C | COL | 4 | 1 | 25.0% | -- | -- |
| 17 | Lawrence Butler | RF | ATH | 4 | 1 | 25.0% | -- | -- |
| 18 | Nolan Schanuel | 1B | LAA | 4 | 0 | 0.0% | -- | -- |
Ivan Herrera leads the hitter leaderboard at 80%. He is a catcher by defensive position (noted as C in the Pos column), but these four wins all came from the batter's box. His success here is interesting, but it tells us about his plate discipline as a hitter, not his challenge skill from behind the plate.
Kyle Schwarber has the most hitter challenges of anyone on this list at six, with four wins. Schwarber has one of the best eyes in the game. That tracks.
Hunter Goodman at rank 16 is the other catcher by defensive position in this group. One win in four hitter challenges.
3. Do Catchers Challenge Better When They Hit? No.
One natural follow-up question: when a player whose defensive position is catcher steps to the plate and challenges, do they win at a higher rate than regular hitters? Does their time behind the plate give them an advantage reading the zone from the other side?
Catchers by Defensive Position, Their Hitter Challenge Win Rate
| Rank | Player | Team | Hitter Challenges | Wins | Win Rate |
|---|---|---|---|---|---|
| 1 | Tyler Stephenson | CIN | 2 | 2 | 100.0% |
| 2 | Ryan Jeffers | MIN | 2 | 2 | 100.0% |
| 3 | Ivan Herrera | STL | 5 | 4 | 80.0% |
| 4 | Gabriel Moreno | AZ | 3 | 2 | 66.7% |
| 5 | Hunter Goodman | COL | 4 | 1 | 25.0% |
| 6 | Austin Wells | NYY | 2 | 0 | 0.0% |
The sample is thin. Catchers do not bat as often as everyday position players, so their hitter challenge totals are low. With this few events, individual win rates bounce around too much to draw conclusions.
What the data shows at the group level: catchers by defensive position are winning their hitter challenges at roughly the same rate as the broader hitter population. Their zone expertise from behind the plate does not appear to translate cleanly to the batter's box. These are different skills.
The real catcher advantage shows up in the section one table: when catchers challenge as a group from behind the plate, they win 60.6%. That is the number that matters, and it comes from a completely different challenge pool.
4. How Much Has ABS Changed? The Impact So Far
| Who Challenged | Result When They Won | Count |
|---|---|---|
| Hitter (from the plate) | Called strike 3 reversed to ball, at-bat continues | 54 |
| Hitter (from the plate) | Other call reversed in hitter's favor | 26 |
| Catcher (from behind the plate) | Called ball reversed to strike | 47 |
| Catcher (from behind the plate) | Other call reversed in pitcher's favor | 24 |
54 strikeouts have been reversed to live at-bats because a hitter challenged and won. 47 called balls have been turned into strikes because a catcher challenged and won.
In two weeks of baseball. 646 total challenges, 342 successful.
Every one of those 54 reversed strikeouts is an at-bat that continued when it would have ended. Every one of those 47 reversed balls is a strike that changed the count, moved the pitcher ahead, and altered what happened next. Over a 162-game season, these numbers compound into something significant.
5. Is Hitter Challenge Success a Real Skill? Walk Rate Says Yes.
The correlation question is what I was most curious about. Are hitters who win challenges also better at reading the strike zone in general? Or is this noise?
I ran Pearson correlations between hitter ABS challenge win rate and two plate discipline metrics for every player with four or more hitter challenges and available discipline data.
O-Swing% vs. Hitter ABS Win Rate: weak correlation (r = -0.197) | r2 = 0.039 | n = 30
Walk Rate (BB%) vs. Hitter ABS Win Rate: moderate positive correlation (r = 0.362) | r2 = 0.131 | n = 30
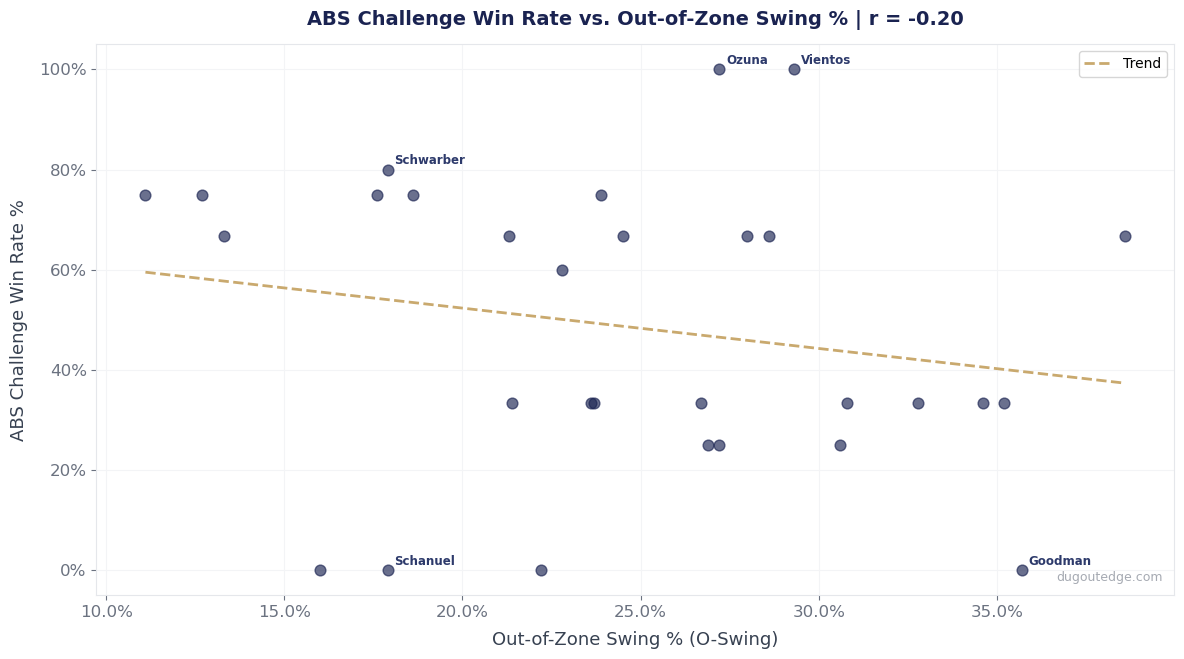
O-Swing shows a weak negative correlation. The direction is right: players who chase less tend to challenge better. But r-squared of 0.039 means O-Swing explains less than 4% of the variance in hitter challenge win rate. Not enough to make strong claims.
Walk rate is the more interesting number. An r of 0.362 is a moderate positive signal: patient hitters who draw walks are winning challenges at a higher rate. This makes intuitive sense. Walk rate measures how well a hitter distinguishes balls from strikes across hundreds of plate appearances. That same discrimination applies when deciding whether to challenge.
Early verdict: there is a real signal connecting plate discipline to hitter ABS success. It is walk rate specifically, and it is moderate at this sample size. Worth tracking as the season grows. The connection between plate discipline and ABS performance also reinforces what our article on swing adjustments by count shows: hitters who read the zone well make better decisions in two-strike counts too.
Conclusion
The data has answers.
Verdict on the main question: Catchers win, and it is not close. 60.6% from behind the plate versus 47.6% from the batter's box. When you understand what each group is being asked to do, the gap makes sense.
Other things the data shows: Hitter challenge skill is real and measurable. Walk rate correlates at r = 0.362. Patient hitters are better challengers. 54 strikeouts and 47 called balls have already been reversed, two weeks into a new system that is going to compound over a 162-game season.
What I am watching: Does the catcher advantage hold as teams get more experienced with the system? Does the walk rate correlation strengthen with more data? And are any teams developing a systematic approach to when they use their challenges?
I will update this at the midseason mark with a full first half of data.
In This Series
These articles use public MLB data to answer questions youth coaches actually ask:
- Do MLB Hitters Change Their Swing With 2 Strikes?
- Bat Speed Doesn't Matter As Much As You Think
- The 5-20 Degree Window: Attack Angle Explained
- What a Short Swing Actually Means
- Batting Average Is Lying to You About Your Hitters: What to Measure Instead
- Blasts: The Most Valuable Swing in Baseball
- How to Set Your Batting Order: What MLB Data Says
- When to Bunt: What Run Expectancy Data Says
- When to Steal: The Break-Even Math
Data sourced from Baseball Savant ABS Leaderboard and Statcast custom leaderboards. Player positions from MLB Stats API. Correlations computed using scipy.stats.pearsonr on n = 30 players with 4+ hitter challenges and available discipline data. Analysis run April 11, 2026.
About the Author
Former Stanford baseball player and professional in the Seattle Mariners organization. 7 years in professional data analytics. Founder of Dugout Edge.
Tags
Ready to Generate Your Perfect Lineup?
Try our free softball and baseball lineup generator to create balanced, fair lineups in minutes.
Try Free Lineup Generator